
PROCEDURE 6
The immediate off voltage measurement
(Sometimes mistakenly called the off potential).
Pipe-to-soil polarized potential measurement, made immediately after the cathodic protection current has been
switched off
This procedure is designed to eliminate a significant error resulting from the voltage drop caused by the current from
the CP system/s.
The following procedure was used in Nigeria in 1976 to try out suggetions made through Shell International by a laboratory in the Nederlands that I believe to be the originators of the 'off' theoretical method of measuring the polarised potential of a steel, coated and buried or submerged pipeline.
INSTRUMENTS AND EQUIPMENT.
An analog voltage recorder with a chart speed of at least 10mm/sec, capable of showing a trace during a one
second period. It must have a range of 0 to 4 volts DC and a chart at least 100mm wide. It must have at least 4
channels, capable of working concurrently, leaving identifiable traces.
Sufficient synchronized current interrupters to switch all sources of CP.
Cu/CuSO4 electrode.
Two lengths of flexible cable, each fitted with a voltmeter connector and a crocodile clip.
Field notes
Report forms
METHOD
5.1.1 Set up the chart recorder and carry out procedures 2,3 4 and 5.
5.1.2. Mark the chart with the location of the test, the time and date. (unless this is done automatically by the
recorder.)
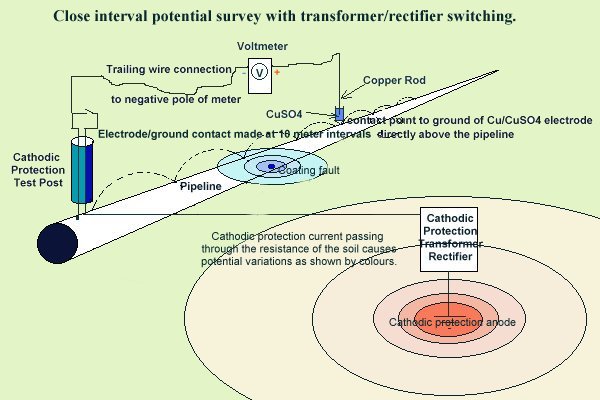
5.1.3. Install the synchronized current interrupters at all the CP installations that effect the test location.(see
procedure 5) The cycle should be set to switch the CP off for 3 seconds and back on for 12 seconds.
5.2.1. Connect the pipeline test point to the negative pole of channel 4 of the recorder.
5.2.2. Connect a Cu/CuSO4 electrode to the positive pole of channel 4 of the recorder.
5.2.3. Place the electrode firmly in the standard position at that test point.
5.2.4. Check that the chart is running at sufficient speed to show a 'kick' in the trace which might occur during
the first second 'off'.
5.2.5. Mark the start of the procedure on the chart paper
5.2.6. Run the recorder for at least two minutes, to secure eight 'on/off' cycle traces.
5.2.7. Decrease the chart speed to 1mm/sec and leave running until a consistent trace pattern is obtained on all
channels.
NOTE. This is to allow analysis of the traces on channels 1,2 and 3 which are used to correct errors caused by
surges in potentials.
INTERPRETATION
The value known as the 'polarized potential' is the voltage at the first deviation from the vertical part of the
recorded trace. Unfortunately, the mechanics of the recorder leave no vertical trace, but the first deviation, from
the downward movement of the chart pen, is normally discernible.
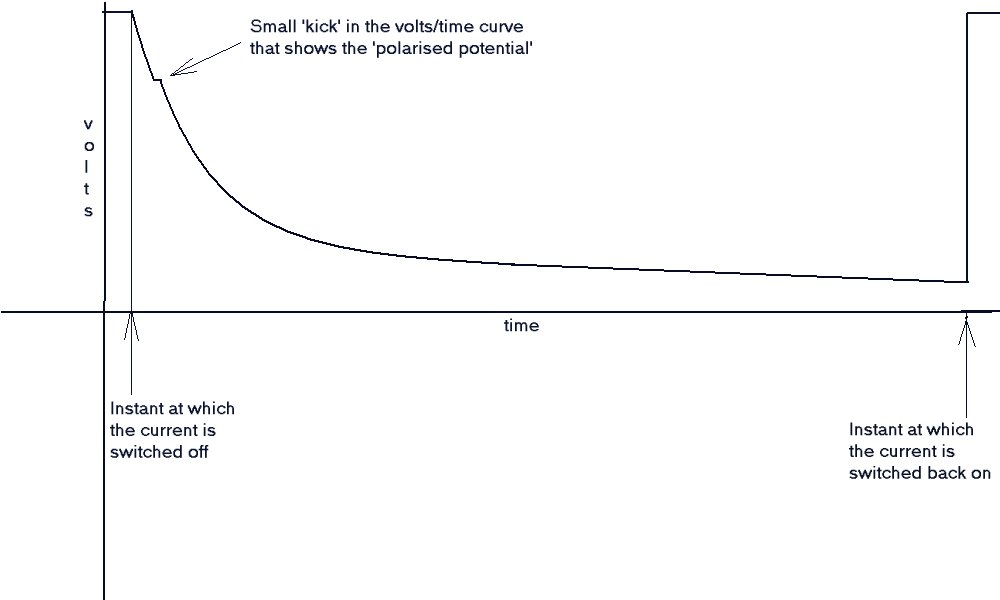
If the current is interrupted by switching off the AC supply to the transformer, there can sometimes be a
momentary reversal of polarity in the CP system as a whole. This is sometimes seen as a distinct ledge or even a
small peak in the otherwise downward trace.
Any negative value below -0.850v is then considered to be unprotected.
This assumption has no basis in science and is not supported by any of the equations or diagramns of Newton, Einstein, Nernst, Gibbs, Pourbaix or any of that gang.

NOTES
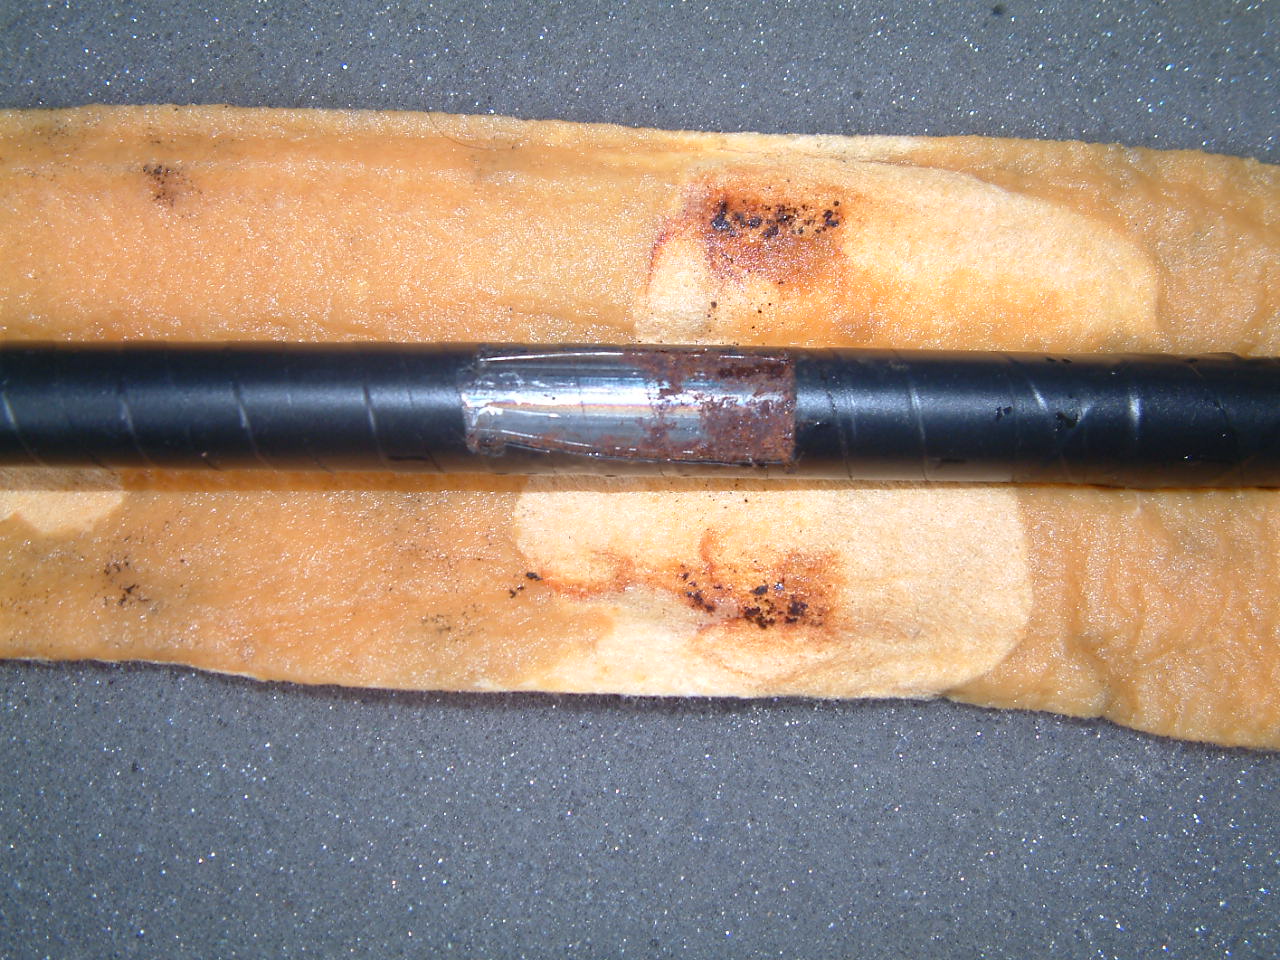
'Off potentials' sometimes show alarmingly low readings, from which it is then assumed that there is no protection at all. However, when the pipe is excavated, it is often found to be in pristine condition, even at coating faults where the pipe metal is exposed to corrosive electrolyte.
In many such instances, other steel objects, buried in the same backfill, have been found to be corroded to destruction. It was then clear that the CP was effective and the measuring technique was not giving the correct indications.
This could be due to the difficulty in obtaining true polarized potentials, which sometimes have to be read within the first second of the impressed current being switched off.
One of the major difficulties is in actually seeing the polarized potential on a digital meter, as the decay can start within the first second, and be quite rapid, so we are looking for a kick which may be masked by the meter itself.
The reason for this is that a digital meter has to change its display sufficiently slowly to allow the human eye to register the readings, and the important 'kick' can be masked in the continuous change of voltage readings shown from the moment that the CP is switched off.
Even data-logging systems are prone to this disadvantage, so an analog chart recorder or digital osciloscope is the preferred instrument for this procedure.
The total misunderstanding of the theory behind this procedure and the expression 'IR drop' in science has resulted in an expensive and complex recommendation by some commercial organisations
IR is an expression used in the equation IR=E and the word 'volt' is commonly used by electricians, engineers and scientists to mean the measurement that describes the electrical status between two potentials. Why did a handfull of specialists coin the expression IR drop? This confuses many people and isolates the corrosion control community from the rest of science and technology. It makes us look stupid.
The expression IR drop is used by scientists to mean a zone into which a reference electrode will cause an inaccurate measurement. This can be seen in many scientific documents, advisory publications, and codes of practice.
The IR drop cannot be measured in volts as it is an indeterminate slope of microscopic proportions.
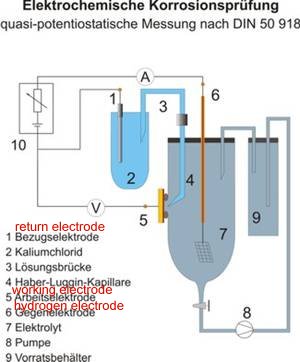
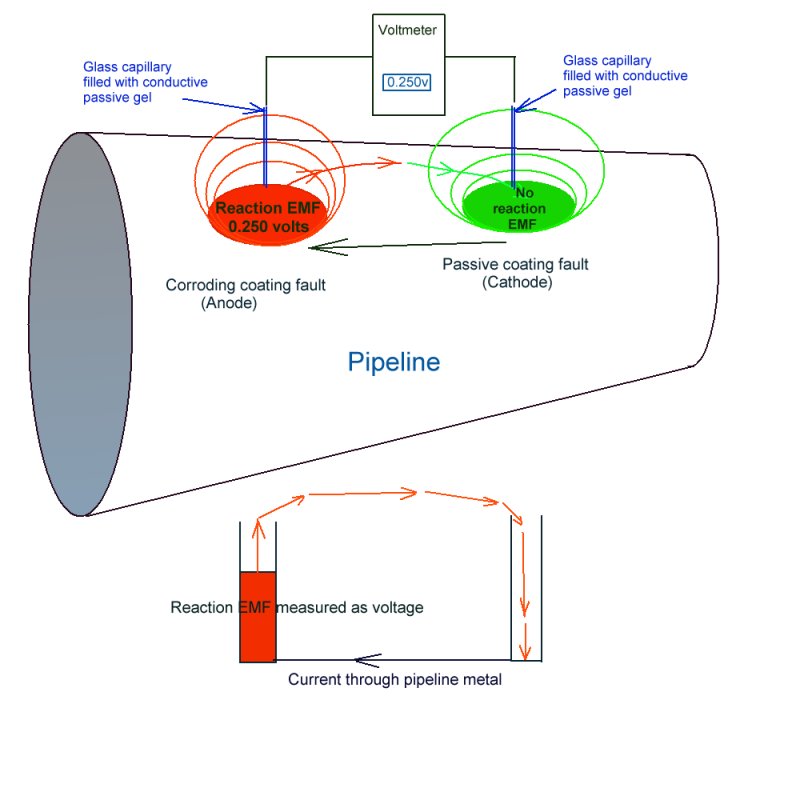
In a corrosion cell there is an anode that is sometimes refered to as the working electrode the surface of which is reacting to the electrolyte. The energy that is released from this reaction in the form of electrical charges is measurable on a voltmeter.
This energy radiates out from the reaction into the electrolyte filling the space between the anode (working electrode) and the cathode (the return electrode)
Because of the laws of diffusion and transport of energy, the mathmatics of this diffusion of energy can be likened to the inverse square law of radiation in that the value of the potential reduces as it radiates further from the reaction itself.

The exact value of the electro-motive force of the reaction is the only factor that can determin the potential required to reach equilibrium in this system without a current flowing from the metal into the electrolyte.
It can be repeatedly demonstrated that the current flowing from a corrosion reaction is directly proportional to the weight of metal going into solution.
It is often quoted that one amp for one year will disolve 17 lbs of steel and although I have not checked this personally it seems likely from my own experiments that this is true.
In the laboratory we can put a small glass tube filled with inert conductive gel into the zone of the reaction before diffusion occurs. (this tube is know as a Lugin Capilary and I have made them in the past by heating a glass test tube, stcking a pin in it and drawing out a tin bit of glass that is broken off at the end to leave a thin tube extrusion). We can never do this in the field as we do not even know where each corrosion cell is and the proportions of their anodes to cathodes and cannot divide the metalic part of the circuit to make a current measurement.
The voltage drop in the soil is something entirely different and a great deal more complex.

It yields a potential profile that can be measured but that can also be in flux (that is changing with time).
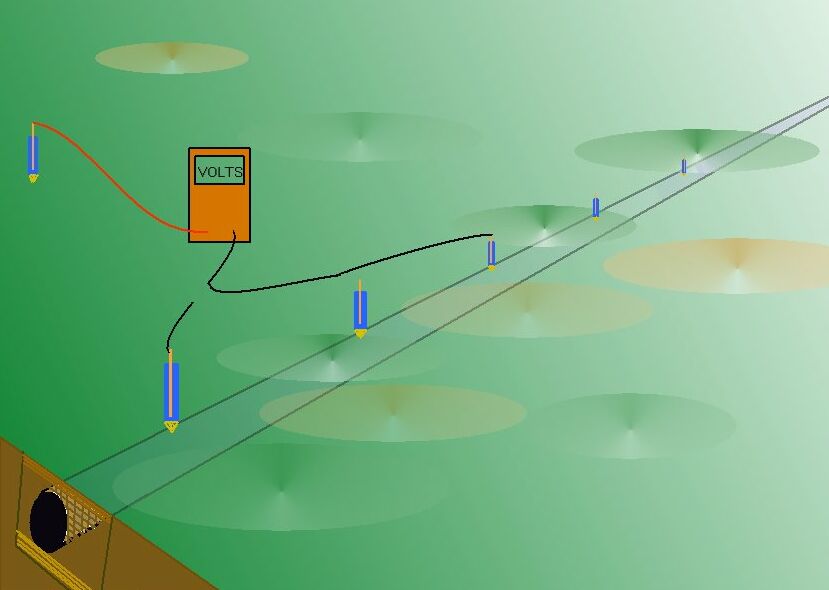
This potential profile is the result of electrical charges passing from a higher potential to a lower potential through the ground and can, in some respects, be visualised as electrical pressure contours.
You can make a three dimensional graph of this potential profile using two ground contact electrodes and this is described in another Cathodic Protection Network Procedure called the two half-cell grid survey..

The ground itself is always charged by a multitude of sources of energy from sunspot activity to man made sources such as earthing systems and transmission of charges for use in electrical work.
To understand this and cathodic protection we can visualise the whole of the world as an ocean of charges in which there are currents and eddies. We can pour a bucket of water in one part of the ocean and draw a bucket of water out of another place miles away. This is similar to what we are doing when we apply impressed current cathodic protection.
We must not use this analogy in our reasoning about cathodic protection as our ocean of charges is three dimensional and not subject to gravity like water. In some respects it is like gas, and gas is more difficult to visualise as you cannot see it.
Switching the CP system off does not and cannot remove the errors inherant in pipe to soil measurements and only serves to identify that component of the electrical flux that is due to the sources of enrgy that are switching.
This understanding is crucial to the analysis and understanding of all cathodic protection monitoring including DCVG and CIPS surveys that in many instances are deliberately and knowingly miss-sold.
click to return to previous page